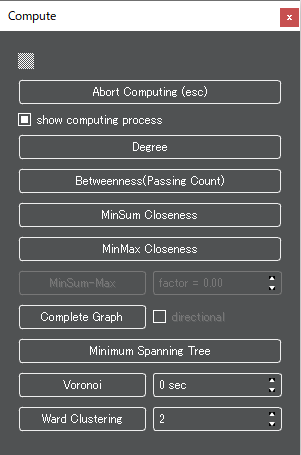
Abort Computing(esc): It aborts current calculation.
show computing process: It shows calculating process. It may take time to get final result.
Degree: It counts up degree(number of edge connection) of each node.
Betweenness(Passing Count): It counts up number of passing times on each node, when Origin(s) to Destination(s) are routed by shortest paths (or k ranked paths, or buffered paths, set at ShortestPath panel ).
MinSum Closeness:
In case if number of Origins > number of Destinations: It sum up the reaching time from Origins at each node. Then it draws heat-map, it colored as hotter(red) as the node’s sum time was shorter. The hotter colored node means averagely closer from Origins.
In case if number of Origins < number of Destinations: It sum up the reaching time to Destinations at each node. Then it draws heat-map, it colored as hotter(red) as the node’s sum time was shorter. The hotter colored node means averagely closer to Destinations.
MinMax Closeness:
In case if number of Origins > number of Destinations: It estimates the reaching time from furthest Origin at each node. Then it draws heat-map, it colored as hotter(red) as the node’s reaching time was shorter. The hotter colored node means closer from furthest Origins. It finds closer nodes for worst access.
In case if number of Origins < number of Destinations: It estimates the reaching time to furthest Destination at each node. Then it draws heat-map, it colored as hotter(red) as the node’s reaching time was shorter. The hotter colored node means closer from furthest Destinations. It finds closer nodes for worst access.
Complete Graph: It finds a tree which connects all Origin(s) and Destination(s) by shortest paths.
Minimum Spanning Tree: It finds minimum spanning tree of all Origin(s) and Destination(s).
Voronoi: It colors voronoi area of Origin(s) and Destination(s).
Ward Clustering: It generates cluster of specified number by ward method.